항상 글을 적는 것은 쑥스러운 일인거 같습니다.
어디서 시작해야지 할지 모르겠지만 공유하면 좋은 정보 일거 같아서 우선은 두서 없이 적겠습니다.
현재 저는 쿠버네티스 위에 자원을 관리하기 위한 다양한 툴을 써보고 있는데 그중에 가장 유명한 오픈 소스는 당연히
프로메테우스 일거 같습니다.
Prometheus - Monitoring system & time series database
An open-source monitoring system with a dimensional data model, flexible query language, efficient time series database and modern alerting approach.
prometheus.io
위 링크는 공식 홈페이지 주소 이고 실제로 체험하고자 하면 설치를 하고 사용할 수 있도록 문서화가 잘 되어 있습니다.
그 외에도 다양한 블로그에서 해당 부분에 대해서는 언급을 많이 하고 있기에 따로 설명하지 않을 거 같습니다.
프로메테우스는 기본적으로 데이터를 수집하게 되면 WAL(Write Ahead Log) 이라는 방식으로 수집 해서 데이터 베이스에 저장하게 됩니다.
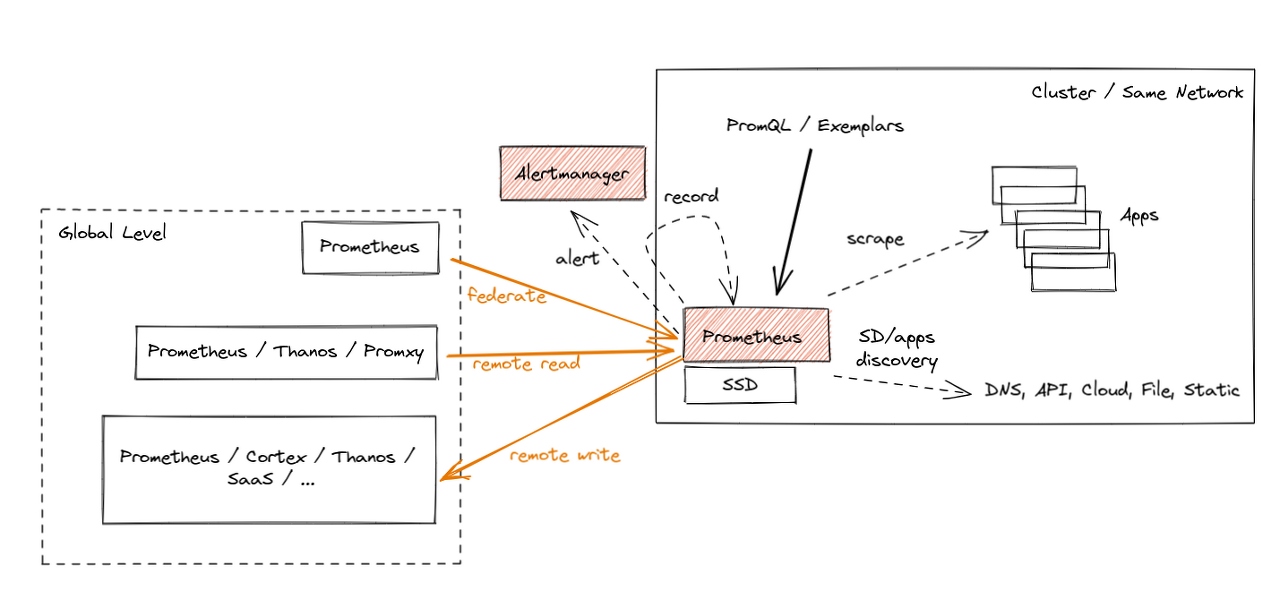
각각의 서비스에서 데이터를 가지고 오면 해당 데이터를 로그 형식으로 저장하고 이후 데이터 베이스에 데어터를 저장하게 됩니다.
즉 시스템이 도중 정지 되어도 해당 사항을 로그에 저장하게 되어서 지속적으로 데이터를 유지할 수 있는 장점이 있지만 결국 파일 입출력이 일어나게 됩니다.
결국 이러한 방식 보다 agent 형식으로 메모리에 데이터를 저장하고 다른 곳에서 수집하는 agent 버전을 promethues 에서 발표하였습니다.
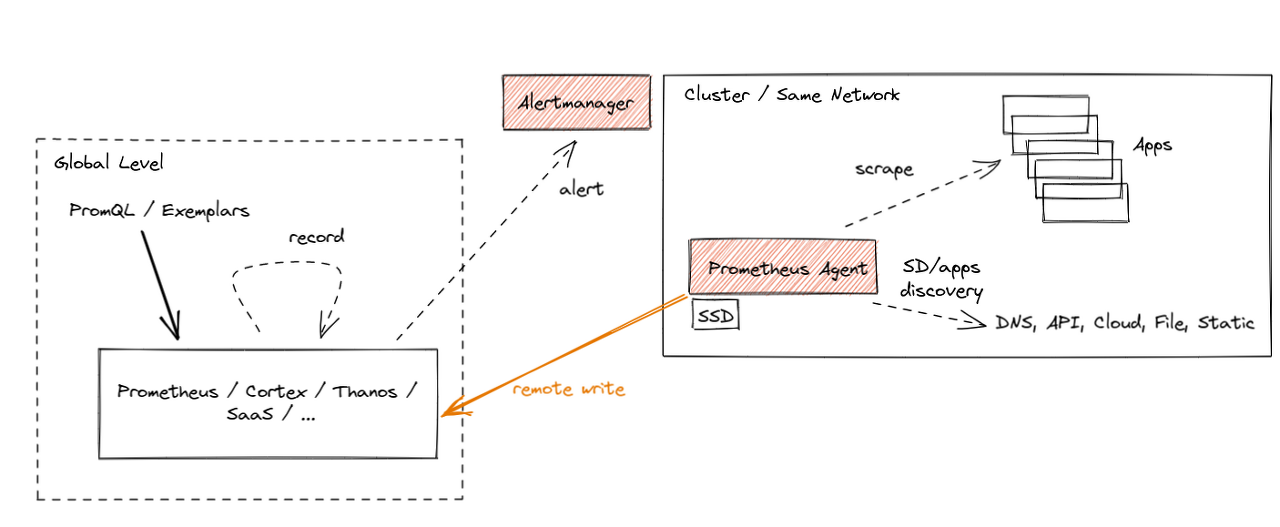
해당 방식을 통해서 데이터를 수집 하되 해당 노드에서 수집된 데이터를 저장하는 것이 아닌 한군데로 데이터를 수집 해서 해당 클러스터 혹 노드에서 데이터를 수집하는 형태로 구성되게 되는 것입니다.
이러한 구조를 만들기 위해서는 우선 설정 해두어야 하는 것들이 있다.
1. 데이터를 scrape 하는 곳에서 agent 모드를 명시할것
--enable-feature=agent
apiVersion: apps/v1
kind: Deployment
metadata:
  name: prometheus-deployment
  namespace: monitors
  labels:
    app: prometheus-agent
spec:
  replicas: 1
  selector:
    matchLabels:
      app: prometheus-agent
  template:
    metadata:
      labels:
        app: prometheus-agent
    spec:
      containers:
        - name: prometheus
          image: quay.io/prometheus/prometheus:v2.32.0-beta.0
          args:
            - "--enable-feature=agent"
            - "--storage.agent.path=/prometheus"
            - "--config.file=/etc/prometheus/prometheus.yml"
          ports:
            - containerPort: 9090
          volumeMounts:
            - name: prometheus-config-volume
              mountPath: /etc/prometheus/
            - name: prometheus-storage-volume
              mountPath: /prometheus/
      volumes:
        - name: prometheus-config-volume
          configMap:
            defaultMode: 420
            name: prometheus-agent-conf

        - name: prometheus-storage-volume
          emptyDir: {}
2. 데이터를 취합하는 곳 즉 remote write 하는 destination 에서 remote write 를 허락하는 flag 를 추가 해주어야 하는 것이다.
--enable-feature=remote-write=receivertsdb path 는 명시하지 말것 -> agent 모드 이기 때문에 tsdb 가 필요하지 않다.
apiVersion: apps/v1
kind: Deployment
metadata:
  name: prometheus-deployment
  namespace: monitors
  labels:
    app: prometheus-server
spec:
  replicas: 1
  selector:
    matchLabels:
      app: prometheus-server
  template:
    metadata:
      labels:
        app: prometheus-server
    spec:
      containers:
        - name: prometheus
          image: quay.io/prometheus/prometheus:v2.32.0-beta.0
          args:
            - "--storage.tsdb.path=/prometheus"
            - "--enable-feature=remote-write-receiver"
            - "--config.file=/etc/prometheus/prometheus.yml"
          ports:
            - containerPort: 9090
          volumeMounts:
            - name: prometheus-config-volume
              mountPath: /etc/prometheus/
            - name: prometheus-storage-volume
              mountPath: /prometheus/
      volumes:
        - name: prometheus-config-volume
          configMap:
            defaultMode: 420
            name: prometheus-server-conf

        - name: prometheus-storage-volume
          emptyDir: {}
이런식으로 deployments 를 만들어서 배포하게 되면 agent 에서 데이터를 모으고 다른 prometheus 에서 데이터를 수집하게 된다.
다른 툴들과의 벤치 마크 를 제공하고 싶지만 아직까지 실전에서 데이터 수집을 하지 않았기 때문에 해당 부분에 대해서는 추가적으로 진행하게 되면 작성할 수 있도록 하겠습니다.
혹 수정해야 하는 부분이 있는 경우 알려 주시면 수정할 수 있도록 하겠습니다.
[자료 출처]
https://prometheus.io/blog/2021/11/16/agent/
Introducing Prometheus Agent Mode, an Efficient and Cloud-Native Way for Metric Forwarding | Prometheus
An open-source monitoring system with a dimensional data model, flexible query language, efficient time series database and modern alerting approach.
prometheus.io
https://prometheus.io/docs/prometheus/latest/storage/
Storage | Prometheus
An open-source monitoring system with a dimensional data model, flexible query language, efficient time series database and modern alerting approach.
prometheus.io
'DevOps 잡다구리 > Kubernetes Stuff' 카테고리의 다른 글
| [Kubernetes] ArgoCD Operator on Kubernetes with OLM (0) | 2022.06.17 |
|---|---|
| [Kubernetes] Kubernetes Elasticsearch operator (0) | 2022.06.06 |
| [Kubernetes] Kubernetes 소스 코드 겉핥기 - Kubeadm reset (0) | 2022.01.04 |
| [Kubernetes] Kubernetes 소스 코드 겉 핥기 - Kubeadm 뭐하는 놈인가? (0) | 2021.12.17 |
| [Kubernetes] Volsync rclone replication 을 통한 데이터 백업 (0) | 2021.11.29 |


